What are Infographics?
An infographic is a visual representation of data and meant to simplify otherwise complex or boring subjects. ‘A picture is worth a thousand words’ explains the philosophy behind infographics as images are easier to understand than plain text and can grab reader’s attention. However, images often lack information as they cannot fully communicate details without words.
Infographics combine the visual appeal of images with the power of words. They are bite-sized pieces of info that anyone can digest. That’s the main reason they have become an important element of many digital marketing campaigns. Cave drawings are considered to be the earliest examples of infographics and we have come a long way since then.
A visually engaging infographic that appeals to the target audience helps generate:
- Inbound links
- Addictive and viral content, people like to-the-point facts and stats that are easy to digest
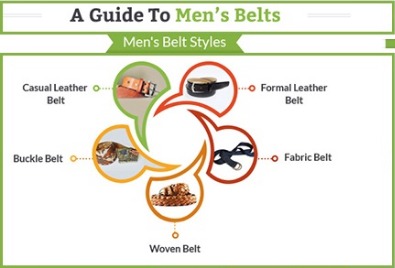
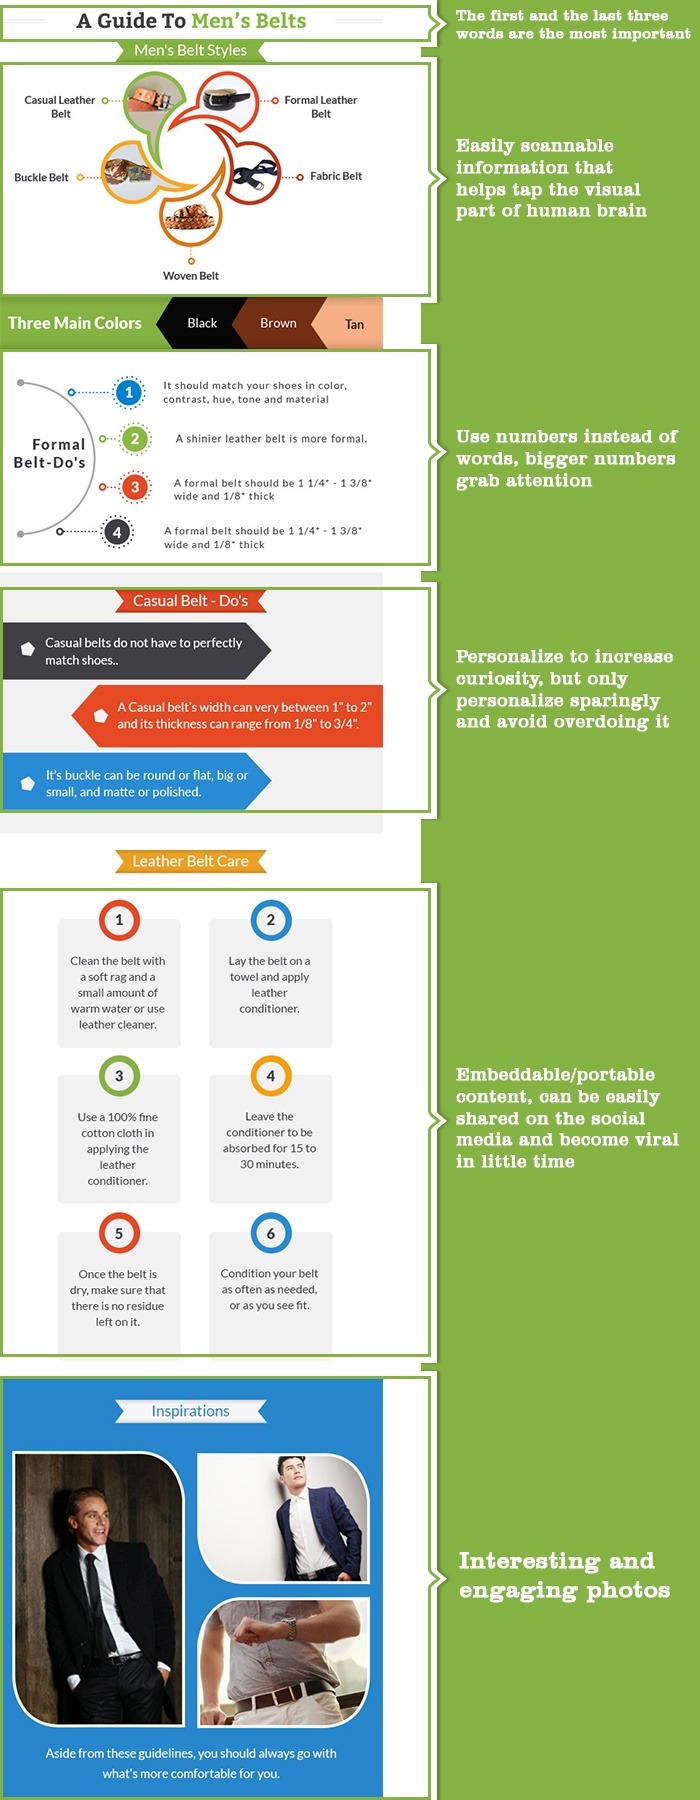
- Easily scannable information that helps tap the visual part of human brains
- Embeddable/portable content, can be easily shared on the social media and become viral in little time
- Global coverage, much better than the print media
- Brand awareness with logos and brand messages
- More traffic
- Positive social media response
- Boost SEO efforts
More page views
Infographics save readers from having to scan through tons of text and enable them to quickly find the important information they are looking for. They are a fun and interactive way of learning about a specific topic and are available in different styles, but the common goal of all of them is to be shared. An infographic can be used to:
- Visualize stories or complex topics
- Educate people
- Build Brand awareness
- Generate inbound links
- Compare products/services
- Create timeline
- Generate PR materials
- Create How-tos and visual product guides
- Generating lists such as top 10s
- Aid product launch
- Illustrate problems and call to action
How Infographics can be Useful for Businesses?
Since 90% of the information transmitted to our brains is visual, a quality infographic is about 30 times more likely to be read than plain text. Publishers that use infographics are likely to generate 10-15 percent more traffic than publishers that do not use them. Infographics can be used in any environment and discipline, whether it is a public environment, subway map or traffic sign.
Design plays an important role in creating value as humans have a natural preference for beauty. Good design allows businesses to differentiate themselves from the competition and ward-off commoditization. Typical reposts and text can deter readers from getting engaged, while we also don’t like getting lost in tons of words to find the information we are actually searching for.
Infographics have become a trend wave that’s worth catching and businesses should not miss the opportunity. Infographics on different platforms have increased by hundreds of times since the last 5-7 years, which means there is no excuse why businesses should not make them a part of their online marketing efforts.
Presenting important information visually clarifies messages and makes it easier for the readers to digest information. An attractive and compelling infographic not only answers specific questions but also facilitates the decision-making process. Businesses can use infographics to:
- Grab reader’s attention
- Go viral!
- Make otherwise complex information digestible
- Demonstrate their expertise
- Spread the word
- Boost brand value
Getting Started with Infographics
While there is no shortage of online tools such as Canva, Venngage, and Piktochart that help users easily create engaging infographics, there are some things we need to consider before getting started. Creating infographics is not just about presenting information visually. It’s an art as well as a science of effectively combining the best of design, images, and text.
Understanding text mainly depends on the ability of the readers to process information. The purpose of infographics is to take advantage of strengths of text and image and minimize their weaknesses as a communication medium.
Topic and Title
Choosing a unique topic that interests the target audience is the first and perhaps the most import element of an infographic. An interesting topic with a catchy title is more likely to generate views than an infographic that just lists information with some pictures. With an endless stream of information on social media and email, most people only go through the headline.
A simple headline just won’t cut it to compete for reader’s attention. The best way to come up with a catchy title is to brainstorm a few dozen titles and note them down. From there it becomes easier to narrow the list down and pick the best ones. Creating a headline can actually be a lot of work, but being 80 cents of the dollar it’s worth the effort.
A general formula for an infographic title = The trigger word or number + Adjective + Keyword + Promise e.g. How to Sell Your Car Effortlessly in Less Than 24 Hours or 10 Effective Ways of Cutting Your Utility Bills. Here are a few tips that can help generate a short and sweet infographic title:
- Should ideally be maximum 65 characters long and up to 6 words
- The first and the last three words are the most important
- The lesser the readers have to scan through, the higher the chance of retaining attention
- An effective title should speak directly to the reader and include/reference them
- Use adjectives that are interesting such as absolute, unique, essential, strange
- Using negative words including ‘No’, ‘Stop’ and ‘without’ helps tap into reader’s insecurities and are likely to generate more views
- Use numbers instead of words, bigger numbers grab attention
- Personalize to increase curiosity, but only personalize sparingly and avoid overdoing it
- A title must match the content body
- Should be very specific
- Avoid constructing sentences that communicate dual meanings
Choosing the Topic
Choosing a great topic involves understanding your audience and the industry/niche. If you don’t have a revolutionary idea, it’s better to compare the ideas you have in mind with the trending topics to generate a list of ‘hot’ topics.
Infographics should be based on the audience you are targeting and should address specific topics. Targeting also includes the selection of images, statistics, and graphics. For example, use colors that speak to a younger audience when designing infographics targeted at teenagers.
Research
Fewer words should not mean less information as properly researching the topic also plays an important role in creating a useful infographic. The information should include a variety of credible sources (ideally at the end) and statistics to back your claims up. However, it’s not recommended to include too much text and figures in the infographic, while it’s also better to avoid white backgrounds.
Break Information into Little Pieces
Distill the information into smaller pieces or bullet points and depict bullets in place of text wherever you can. Bullet points are easier to scan and allow readers to quickly go through important points.
Visual Design
If you are already working with a designer, things are not too complicated at this point as you just need to pass on the information and tell him/her your objectives. But things can get a little tricky when you are doing it on a self-basis. Sure, you can choose from a variety of online tools to create an infographic, but they offer limited customization and design options.
You can still design an infographic yourself if you are a DIY kind of person. The first step involves sketching out the data as a wireframe. 800-1000 pixels wide is a widely used infographic size, but you might want to try a different size if you are unable to include all the information. It’s better to expand an infographic vertically as that makes it easier to scroll and read.
Keep the style elements such as font, colors, and images consistent and in-line with your brand/site. For example, avoid using bright colors if you are creating an infographic about a serious topic such as cancer and vice versa. It’s better to stick to 2-3 fonts max as using more than that might make everything look disjointed.
Promotion
Social media and your own website are the best platforms to promote your infographics, making it easier for your readers to engage with your brand. You can also let other blogs and websites know about your infographic to get more shares and views. Other methods of promoting your infographics include:
- Creating a mini or snackable version of your content in guest posts (snackable content provides a glimpse of the infographic)
- Repurpose infographics and share it on SlideShare (you might have to leave out some parts of the infographic)
- Repurpose infographics as videos as you already have the images and just have to add some background music, break it into smaller visuals, 1:1 is considered the best ratio as it perfectly fits on both mobile and desktop devices
- Optimize for Search Engine Optimization, choose the keywords carefully, k/w should be there in the post URL, meta description, headings/subheadings, and alt text
- Translate into multiple languages to increase outreach
Conclusion
Coming up with an engaging infographic requires a lot of work and brainstorming, but it pays off really well in the long run. Their viral capabilities and worldwide coverage make them an excellent tool to showcase your expertise, create brand awareness and gain customers’ trust. Even if small businesses do not have what it takes to create a viral infographic (yet), they should at least consider infographics their competitors are promoting and come up with something on their own.